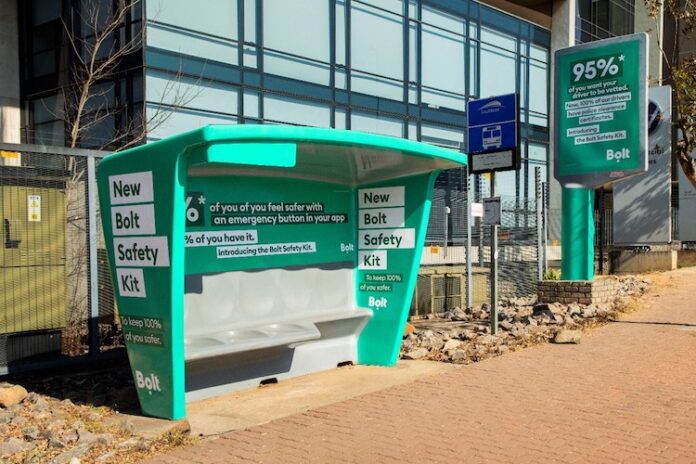
Street Network, a Provantage company, has partnered with Lightstone to launch a holistic street furniture advertising audience measurement.
For brands to achieve maximum exposure coupled with consumer ‘buy-in’, they not only need to identify premium media locations, but identify those locations that provide access to a desired target audience. This is key to ensuring that advertising campaigns are effective in keeping consumers engaged and ultimately making purchases. This is where the OOH industry is getting it right with a strategic focus on big data designed specifically to elevate clients’ advertising campaigns.
‘The proprietary audience measurement will be critical in helping brands and advertisers connect with targeted consumers, while simultaneously being able to quantify campaign reach and impressions. This strategic investment in data is led by our desire to keep the Out of Home (OOH) industry moving forward and constantly innovating,’ said John Faia, General Manager of Street Network at Provantage.
Research already illustrates the effectiveness of street furniture. One in three people exposed to street furniture campaigns recall the advert, with 62% of them having purchased the advertised product online or in-store (ProFusion 2022 – Provantage Proprietary Data Fusion statistics).
This new audience data tool can predict which target audiences will see the street furniture advert through real world location data. For quick decision making, the audience has also been segmented into different target markets (affluent, upper and middle markets), and can be drilled down further to provide details pertaining to household income, size and other demographic parameters, including home language. ‘This allows us to supply the right audience for optimum exposure to all our clients,’ noted Faia.
In line with OOH audience measurement standards, Street Network’s measurement is built on multiple independent data layers ranging from Tracker data, national AutoParc numbers, vehicle occupancy rates (as used by SANRAL), latest census data and Lightstone property data. Data is collected for each road segment on first-time vehicles and returning vehicles throughout the month. It then compares the total number of trips for distinct vehicles and calculates an average frequency rate. Impacts are calculated on a likelihood to see measure, as not every person who passes a bus shelter, bin or pole advert will take notice.
To identify the most appropriate locations and quantify audiences, data is overlayed onto national geographic regions where Street Network’s inventory is strategically placed. The coverage areas are defined and other considerations including budgets applied. All necessary data layers are included, which not only indicates the audience type to be reached, but also the reach, impact and frequency.
Faia added that this measurement method highlights Street Network’s passion for an audience first approach. ‘We want to connect with audiences where they eat, live and play through our hyper local engagement strategy. Our new proprietary data brings this to life, as this approach is now possible with accurate, reliable, and transparent data.’
Gauteng currently provides the highest overall reach figures of over 24 million, primarily around the Marshall, Anderson, Fox and Sauer Street environments in the Johannesburg CBD. High reach figures in other areas are also noted as follows:
– KwaZulu-Natal: In Glenwood around Helen Joseph and Esther Roberts Roads (12,902,948).
– Western Cape: The highest reach figures are achieved in the CBD area around Roeland, Buitenkant, Hanover, Keizersgracht, Strand, Longmarket, Loop, Long and Darling Streets (7,941,950).
– Free State: Reach figures of up to 4,233,764 are attained in Bloemfontein around Nelson Mandela Drive, Oosburger and Hill Streets.
– Eastern Cape: Humansdorp provides a reach of 441,543 within the Voortrekker Road and Siebert Street environments.
On average, a bus shelter in Gauteng yields 3,293,891 likely impacts, 522,042 likely reach and a frequency of 7, while equivalent figures in the Western Cape reflect 1,641,894 impacts, 167,998 reach and a frequency of 10.


